Predictive analytics
By Nora Wolske
Features New Technology Production annex Broiler production Canada Producer tools ProductionTaking data that has been readily available to a whole new level of management.
 Nora Wolske is ventilation products and controls manager for Canarm AgSystems. She has over 18 years of experience working with livestock equipment and ventilation systems. Photo: CLAUDIA MORIN-ARBOUR
Today’s poultry farmers are faced with the necessity of maintaining a profitable balance in managing their livestock facilities. This ongoing challenge, coupled with keeping up with new regulations and animal welfare concerns, add to the complexity of managing a healthy and well-performing flock.
Historically, farmers monitored and observed their production by being physically present in the barn several times per day. Nowadays, most barns have some kind of automation that decreases the need of the farmer to be on-site more than once or twice a day. This presents the freedom to hire farm labour to do the day-to-day chores, so producers can now focus on making management decisions.
In most cases, finding skilled labour, or finding time to be in the houses several times per day, is proving to be increasingly difficult. Having high-end, Internet-enabled controllers can compensate somewhat for that. However, since these monitoring tools only report on what has happened, they therefore give only a snapshot of the current state of the flock.
If a parameter, such as temperature, has strongly deviated from the norm, the farmer will be alerted and given the chance to fix it. If the anomaly has not yet developed into a full-blown issue, there is a high chance the producer won’t be able to act on it until it is too late.
Having the ability to detect performance deviation early is key to success. The onset of a problem might be so slim it may not have registered yet in the current state of the flock. Farmers need solutions that will bring this information to their attention in real-time so they will be able to act on it much sooner. We all know that prevention saves money over remediation.
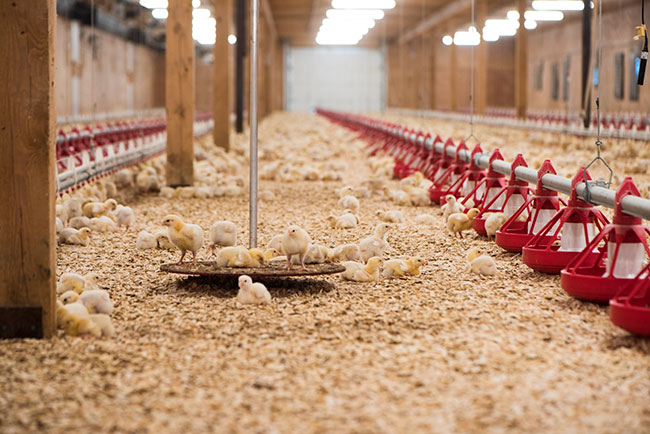
Today’s livestock barns and production buildings are equipped with a lot more sensors than 10 years ago. On top of the common temperature, water and feed monitoring, farmers are now measuring carbon dioxide, ammonia, static pressure, humidity and much more, to ensure that they maintain a good balance between animal health, welfare and profitability. It is not an easy task.
The advent of livestock production data analytics platforms aims at helping farmers manage this delicate balance. The data coming from the house sensors is fed on a continuous basis to these platforms to be read, stored in servers and analyzed to give the producer insights on bird health and expected performance.
Data analytics can be classified in four levels, based on the depth of analysis and process that is applied to the raw data received from the sensors.
At the most basic level, the platforms provide historical data in aggregated form. Some provide a way for the producer to visualize this data in chart form. Others are able to graph this data. This is helpful to identify trends, evaluate retrospectively such things as the impact of a new feed type and decide on the future conduct of subsequent flocks. Any adjustment made will be “after the fact”.
Taking the data processing a step further, one will find the web-enabled controllers and their proprietary platforms allow farmers to see the current state registered by all connected sensors, as well as alarms that report that a parameter is higher or lower than a user-defined limit. It is helpful to assess how the flock is doing in real time. This also allows the farmer to take action immediately if something is wrong and, thus, limit the consequences on the production performance.
The next level of analytics has the ability to increase the value of the data currently available.
These platforms are able to cross reference graphs and data from multiple sensors in real time to provide the producer with more defined cues in order to make timelier, more effective management decisions. These platforms even predict future performance based on current events.
The final level, which could come sooner than we think, involves a level of automation where one could see the platforms suggesting corrective actions that need to be taken to prevent any deviation identified at the predictive level. The best analytic solutions do not provide more data, but a clearer picture. How does this translate in real life for Canadian poultry farmers?
Air quality
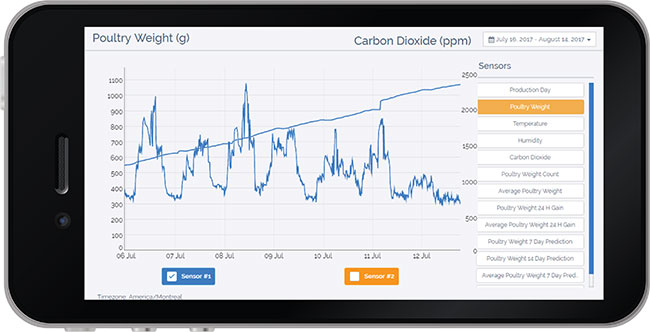
Let’s use air quality as an example. By cross-referencing the birds’ weight and the carbon dioxide levels provided in real time by the analytical tools, a producer will realize that the dip that is visible in the growth curve may be linked to the abnormal level of carbon dioxide in the air. Why? With analytical tools, the producer gets a better representation of what is actually happening in the barn, instead of just viewing random raw data.
With better visibility, in real time, the producer can respond immediately by adjusting the ventilation or taking other actions that will restore the growth curve to its expected progress.
Feed-related expenses
Given the high cost of the feed, delivery expenses and storage, it’s imperative to accurately estimate the quantity of feed each flock consumed.
Analytical tools help the producer better estimate feed consumption based on actual rate of consumption and will aid in creating a more efficient delivery schedule to reduce waste and feed outages. Feed outages negatively affect the health of birds.
This affects their value and losses can even occur. The insights provided by analytical tools are invaluable in preventing these feed outages, and the resulting value losses. Add to that the higher costs of overtime or weekend deliveries and the savings can be very significant.
Nora Wolske is ventilation products and controls manager for Canarm AgSystems. She has over 18 years of experience working with livestock equipment and ventilation systems.
Bird health
The best data analytics solutions allow for the monitoring of various parameters pertaining to bird health in real-time. These timely adjustments can make a big difference in achieving weight targets, reducing condemnation and improving the quality of each flock.
The real-time capture, analysis and interpretation of data generated by livestock production activities is the next step in profitability optimization for the livestock industry.
Farmers need tools to help them manage the delicate balance between animal health, welfare and rising production costs. Real-time data analytics are decision-support systems that will bring insight on the performance of the flocks. By taking timely actions, they will uncover all the savings that are hidden in their production data.
This is the next revolution in poultry production and it is happening right now.
A producer’s experience using predictive analytics to forecast bird weight
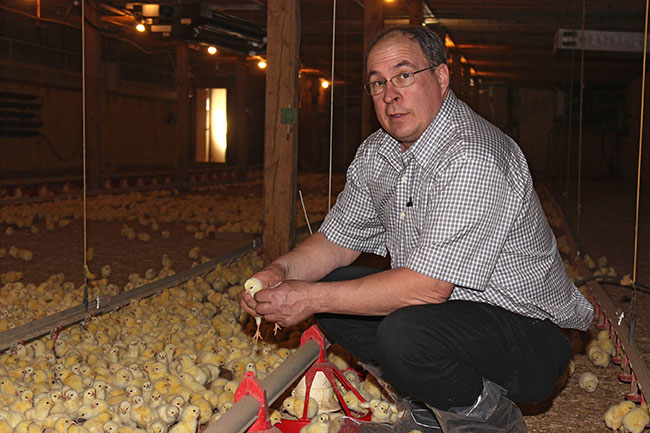
On Monday morning at Forest Farm, broiler producer Stephan Forest enters one of his poultry barns. His chickens arrived five days ago from the hatchery. After walking through the barn to ensure that these newcomers are doing well, the producer takes out his cellphone and consults his flock’s weight prediction on his data analysis platform. He wants to make sure that his chickens will meet the crucial 10-day weight target.
“It’s amazing. I cannot only see what my average bird weight will be at day 10 but what it will be over the next 14 days,” he says. “This kind of data is crucial to us. It helps us make the right decision, when and where needed, to ensure we will meet our performance goals.”
Moreover, by using the previous production data, the platform Forest uses enables him to compare his current growth with his personal best.
Once Forest returns to his farm office, after his daily flock inspection, he finally sits down for breakfast. While enjoying his morning coffee, he navigates through his platform from his laptop and accesses several production metrics.
He can see in real time the average weight of the birds, the average daily gain and the deviation from the target weight for each connected house.
“The uniformity data is very useful,” Forest says. “It helps me assess if the birds are growing optimally or if I need to make corrections to my lighting management for instance. And, if I’m not satisfied by something, I can investigate, using the data from other sensors, like ammonia or CO2, to identify the probable cause. It orients my actions for the day.”
On day 10, he walks through his poultry house and observes his birds’ growth curve on the data analysis platform, with a very satisfied look on his face. Thanks to the latest technology, he was able to adjust his production parameters and his birds are right at their target weight. This flock is off to a great start.
Nora Wolske is ventilation products and controls manager for Canarm AgSystems. She has over 18 years of experience working with livestock equipment and ventilation systems.
Print this page