Measuring Success
By By Luis Romero Rob Renema Martin Zuidhof and Frank Robinson Poultry Research Centre
Features New Technology ProductionIt’s not just about counting chicks
It’s not just about counting chicks
 |
| Calculating chick production per housed hen doesn’t necessarily measure economic success. A flock with 100 per cent economic efficiency has the lowest chick cost, which can be influenced by biological, technical, and input utilization. |
A very common problem for animal production managers is finding adequate methods to measure the efficiency of the production process and the farm as an economic entity in a meaningful and consistent fashion. It’s important to find out whether the technical and managerial decisions are being effective. In the case of broiler breeder production, there are different levels of sophistication in the evaluation of flocks and farms. They go from the simple percentage of production, right up to the measurement of unitary costs in real time. In this article, we present an alternative approach to measure flock and farm success based on existing methodologies of production economics.
The most straightforward evaluation method used to measure flock performance is total egg production. Using per cent production as a measure of success is very tempting. Having a flock peaking at 90 per cent definitely feels good, whether you are selling eggs or chicks. But mortality and settable egg rates need to be accounted for; therefore, many companies and farmers prefer to measure settable eggs per housed hen. This is a fairly good indicator of the efficacy of the production process because at least we know if we are setting the number of eggs we could if everything went well and if we are meeting our production budget.
 |
| Luis Romero (above) has just completed his PhD at the University of Alberta on a project with Rob Renema, Martin Zuidhof and Frank Robinson. He brought economic analysis of production traits to a new level in the broiler breeder research program. |
However, for a company that sells one-day-old chicks or is paid based on potential chick production, eggs per housed hen only tells part of the story of what is happening on the farm. Here, different methods to assess salable chick production are used. Some companies can only generate an estimated hatchability rate for each flock whereas other companies are capable of having very accurate counts of chick production per flock.
In any case, managers can calculate chick production per housed hen, which is an even better indicator of the efficacy of the process. But does this really measure economic success? Not necessarily. Some companies use feed conversion ratios to try to overcome the limitations of simple production parameters. However, even a low feed-to-chick ratio may not translate into improved economic results if feed intake were limiting and production rates were compromised.
From the production perspective, what really determines the competitiveness of broiler breeder companies is the cost of chicks. In turn, there are two main questions that determine the cost: 1) Is the flock in the most biologically appropriate conditions to have ideal performance?; and 2) Is the manager making the right input utilization decisions?
Companies may be capable of answering these two questions as a whole on a day-to-day basis if they have a real time production/accounting system, but we would venture to say there are still many companies that only have an estimate of unitary costs at the end of the production cycle, when it is too late to make any decisions. Even assuming that the company knows what the unitary cost of today’s chicks is, it is not easy to measure the causes of a higher than normal cost. At the very least, it is time consuming and may not account for the nature of the biologic process, particularly if the analysis is only done from an accounting perspective.
New Measure of Performance
These complexities of commercial production brought us to develop a new approach to measure flock and farm performance, which is both simple and effective. This approach is based on the measure of economic efficiency, which is an area of production economics used to evaluate national industries and firms, especially in the manufacturing sector. For the purpose of this article, all concepts are focused on one-day-old chick production, and each broiler breeder flock is considered to be the unit of production.

|
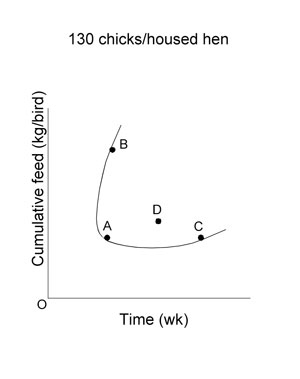
| Figure 1. Possible combinations of cumulative feed intake and time to produce a certain number of chicks are represented by the production frontier line. Flocks A, B, and C are technically efficient, but flock D is not. |
Economic efficiency measures the extent to which the flock has the lowest unitary chick cost possible. A flock with 100 per cent economic efficiency has the lowest chick cost. As previously discussed, this measure is made up of a biologic/technical and input utilization factors, which are measured by what is called technical and allocative efficiency, respectively.
Broiler breeder production involves a great variety of inputs. Consequently, some simplifications are necessary to develop applicable methods. For this particular example we are accounting only for two types of inputs: time-related inputs and feed. The rationale of using time related inputs is that capital and fixed costs have an important share on the unitary costs of one-day-old chicks. On the other hand, feed is usually the single most important cost of animal production.
Under optimal conditions, broiler breeder flocks will require a minimum combination of feed and time to produce a number of chicks (e.g., 130 chicks). This optimal input-output relationship is called the “frontier of production.” This frontier is determined by the genetics of the strain and is represented by the curved line in Figure 1. Flocks A, B, and C are all technically efficient because birds could not do any better in optimal conditions. In contrast, flock D is utilizing more feed and time than should be necessary, probably because of management or health problems; this flock is therefore technically inefficient.
However, flock B is using more feed, and flock C is using more time than flock A to produce 130 chicks. This situation usually occurs because a manager decides to use (or allows) a higher (flock B) or lower (flock C) body weight profile than what it is recommended for this strain of broiler breeders despite birds being managed in optimal environmental conditions. These decisions are responsible for a cost increment.
 |
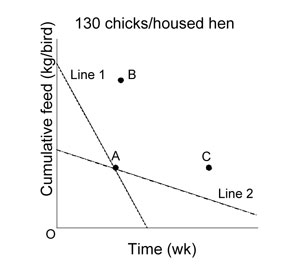
| Figure 2. Minimum cost combinations of cumulative feed intake and time to produce a certain number of chicks are represented by the broken lines. Flock A is economically efficient and flocks B and C are not. |
Both flocks B and C are allocatively inefficient because the input combination is not optimal. The more the cost of feed increases, the more allocativelly inefficient flock B becomes due to unnecessary expensive feed being used. The more the fixed and capital costs increase, the more allocatively inefficient flock C is because birds are taking too long to produce these chicks. The combination of both technical and allocative efficiency determines the economic efficiency of the flock; i.e., how far is the flock from the minimum cost?
Since production frontier calculation requires complex statistical methods, we have made some assumptions to develop a simple method for flock assessment. We can compare economic efficiency of flocks with the production targets based on the input cost conditions of a farm or company. Let’s assume that point A is the target feed-time combination to produce 130 chicks. We can draw a line (line 1, Figure 2) of input combinations that have the same cost as target A, although some of these combinations may not be technically possible.
The slope of this line depends on the relative cost of a kilogram of feed versus the average weekly cost of having a bird in the barn. If line 1 defines the minimum cost combinations, flock B is more efficient than flock C because it is closer to the line. If the cost of feed increases relative to the capital and fixed costs per hen, the position of the line changes (line 2) and we would prefer to use less feed; so, flock C would be more efficient than flock B.
Figure 2 is just a geometrical representation of what being economically inefficient means. Of course, what we want is to be able to assess economic efficiency at every level of production. In our experience, the performance objectives provided by the primary breeder companies constitute a fairly good indicator of the input combination that determines the production frontier. Then, having a table of input combinations to produce each level of output (salable chicks or settable egg numbers) allows calculation of economic efficiency with relatively simple equations.

|
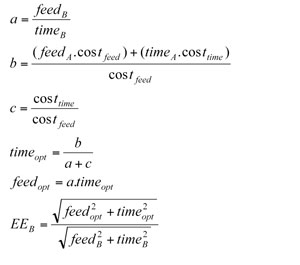
| Figure 3. |
For example, we can calculate economic efficiency (EE) of flock B (Figure 2) relative to the target A (Figure 3). The variables that we need are the feed (kg/bird) and time (wk) used by flock B, the target feed and time to produce this number of chicks (feedA, timeA), the cost of feed (costfeed; $/kg), and the average weekly capital and fixed costs per housed hen (costtime; $/hen/wk). Some instrumental variables (a, b, c) are also used just to make equations simpler in the calculation of optimum feed (feedopt) and time (timeopt).
The EE of flock B should correspond to a value from 0 to 1. However, it is possible that good flocks will exhibit values greater than 1 because we are using the target values to define the frontier. In general, a better economic performance is expected from flocks with greater EE. These EE values can be used independently to compare flocks and farms, or to perform additional analyses.
For instance, the effect of mortality as a source of inefficiency can be evaluated by comparing EE at zero mortality, normal mortality and actual mortality scenarios. Two flocks from the same farm were compared at 50 weeks of age; both had similar peak of production, but one of them (flock 1) had greater mortality than the other (flock 2). The EE scores were 0.87 and 0.94 for flock 1 and 2, respectively. When analyzed on a zero mortality scenario, EE scores were 0.93 and 0.96. Therefore, chicks from flock 1 were expected to have 13% over cost compared to the target unitary costs. From that 13%, 6% was caused by mortality and 7% was caused by management or health issues. For flock 2, 2% over cost was caused by mortality and 4% by management or health. Evidently, there was still potential in this farm to reduce unitary costs besides the effect of any eventual sanitary complication. A 4% reduction in cost can make a big difference in the economic results of the farm. Other factors such as settable egg and hatchability rates can also be assessed using this type of analysis.
Overall, the utilization of economic efficiency as a criterion to evaluate flocks has the advantage of a more consistent relationship with the actual cost of the chicks and the economic results of the company. A more objective system will often mean better decisions and better results. Instead of focusing on increasing production, managers can focus on optimization of economic results, which is what the company expects from them. Ultimately, financial success is not always associated with the highest number of chicks.
Print this page